Being a successful project manager, it means that you have a solid understanding of all of the project management tools and techniques that are typically used by project managers to plan projects, track them, and deal with problems that come up along the way. It doesn’t mean that you follow the exact same recipe for project success every time you lead a project.
In this blog, we will have a deep dive into the most commonly used project management tools and techniques that can influence the successful delivery of your project, and we will provide you with real-life examples, tools and techniques.
What are Project Management Tools and Techniques?
To build a house you need inputs (plans, specifications, permits, financing, building materials, etc.), then you proceed to construction by using tools and techniques (skilled labor and trades, concrete, framing, electrical, plumbing, finish work, etc.); when done, you have a house as your output.
You can think of a project management process as a little machine. It takes the inputs — information you use in your project — and turns them into outputs: documents, deliverables, and decisions. The outputs help your project finish on time, within planned budget, and with desired quality. Project management tools and techniques are used with the inputs of every process to produce the outputs of that process.
For example, in Develop Project Charter, the SOW, business case, agreements, and other inputs are examined using the tools and techniques of this process (expert judgment and facilitation techniques) to produce the project charter, which is the only output of this process.
Project management tools are something tangible, such as a template or software program, used in performing an activity to produce a product or result. Project management technique is a defined systematic procedure employed by a human resource to perform an activity to produce a product or result or deliver a service, and that may employ one or more tools.
For the purpose of writing this blog, the project management tools and techniques should be categorized in one of the following: Data gathering, data analysis, data representation, estimation methods, interpersonal skills, and others.

Data Gathering Techniques
They are often the first project management techniques we employ in a process. Some of the data gathering techniques entail collecting data from individuals or groups, such as focus groups and brainstorming. Some techniques entail collecting information by using tools such as checklists and check sheets.
Brainstorming
Brainstorming is a data gathering PM technique that is used for generating ideas and options and solving problems. It is generally a group activity that has a facilitator to manage the process. It focuses on generating quantity, with the assumption that having a good quantity of ideas will lead to having a good-quality outcome. In the brainstorming session there is no criticism, all ideas are equal, and all are welcome, including those that seem like they are wild ideas.
Brainstorming is commonly used in a facilitated risk identification workshop to identify risks. The standard rules of brainstorming are often modified when the technique is applied to risk identification. It is also very useful in the stakeholder's identification process.
Benchmarking
Benchmarking is one of the most frequently used techniques. Benchmarking is gathering data on the best in class, best in industry, or best in organization practices, processes, and products. The information is used as a target to improve processes, products, and results.
Benchmarking is a process of measuring the performance of a company’s products, services, or processes against those of another business considered to be the best in the industry. The point of benchmarking is to identify internal opportunities for improvement. By studying companies with superior performance, breaking down what makes such superior performance possible, and then comparing those processes to how your business operates.
Benchmarking involves comparing actual or planned products, processes, and practices to those of comparable organizations to identify best practices, generate ideas for improvement, and provide a basis for measuring performance. The organizations compared during benchmarking can be internal or external.
Focus Groups
A focus group is a group of prequalified people who are brought together to provide information about a product, service, or result. A professional moderator uses a question guide to focus the direction of the questions. The moderator also observes behaviors and nonverbal cues and records them in her observations.
Focus groups are most commonly used for new product or new service development. They may be part of a market research campaign to gather requirements or to provide insight into customer opinions, expectations, desired benefits, underlying assumptions, common views, and so forth.
Focus groups generally provide broad qualitative information. The interactions and body language provide a deeper understanding of people’s opinions than questionnaires. The qualitative information can then be analyzed and can be followed up with questionnaires and surveys to get quantitative data by asking ranking questions or closed-ended questions.

Data Analysis Techniques
These project management techniques are usually used to assess and evaluate data in order to discover or gain deeper information about a topic. They can also be used to support decision-making. We use any different methods of data analysis in project management. Some of them are very broad, such as alternatives analysis and decision trees. Others are specific to a particular knowledge area, such as stakeholder analysis.
Cost Benefit Analysis
A data analysis method, it is used to assess options that provide the best approach to achieving benefits while minimizing costs. It can be used to assess the viability of a project and to rank various approaches or alternatives for meeting project objectives.
When looking from a short-range financial perspective, actual costs and benefits are assessed. When looking from the long-term perspective, the time value of money is taken into consideration. This is accomplished by converting future payouts and expenditures into the present value. When assessing whether to do a project, such as when preparing a business case, the present value costs are subtracted from the present value benefits. The sum of benefits less the costs is called the net present value (NPV).
If the NPV is positive, the project is expected to return a profit. The higher the NPV, the more profitable the project. When assessing various approaches to a project, or responses to a risk, you can rank the reference of options by putting those with the highest NPV first
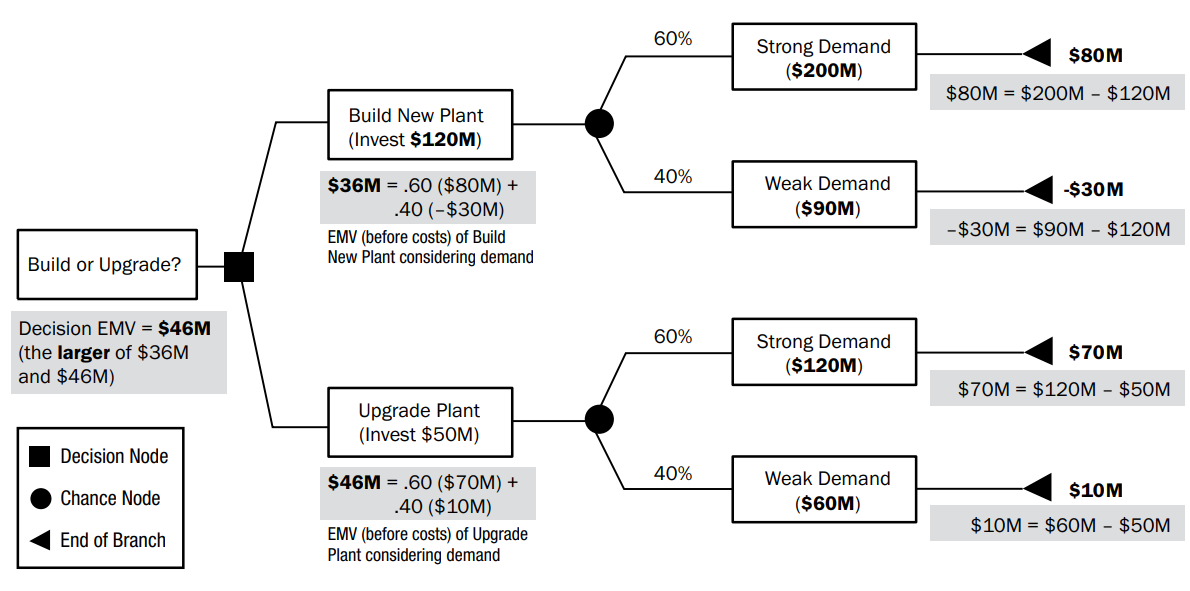
Decision Tree Analysis
It is a data analysis project management technique, and it evaluates uncertainty using a diagram with branches that model various options or outcomes and their implications. In project management, we use it to evaluate which projects to invest in, and to model uncertainty associated with cost, schedule, or risk events.
Decision tree analysis is usually performed using specialized, but widely available software. The software allows the user to specify the structure of the decision with decision nodes, chance nodes, costs, benefits, and probabilities. The decision tree is just a model of what could happen. It is not factual. It is a technique used to model uncertainty. As with any model, the fidelity is only as good as the data behind it. In other words: garbage in, garbage out.
Alternatives Analysis
Alternative analysis is a method used to evaluate and select options or approaches to execute and perform project work. An alternatives analysis can be used at a high level; or you can apply a more complex approach that incorporates a matrix that identifies rating criteria and weighting factors. This technique can be used in several processes and in a wide range of industries.
Alternatives analysis can be used at the start of the project to determine the best approach, during the project to assist in selecting a vendor, in quality management to identify options to respond to quality issues, and in risk management to determine an acceptable risk response.
Root Cause Analysis
Root cause analysis is a data analysis method that is used to identify the underlying cause of a variance, risk, or defect. Often when a problem arises, we rush to fix it by treating the symptom, for example, crashing the schedule to get back on track.
Root cause analysis looks beneath the symptoms to find out what underlying events, conditions, systems, or processes allowed the event or condition to happen in the first place. The underlying assumption when conducting a root cause analysis is that variances, defects, and risks have an underlying cause in a system or process. The goal of root cause analysis is to trace the problem back to its source so that you can fix the source of the problem.

Data Representation Techniques
Project management tools and techniques that are used to really understand what data is telling you, sometimes you need to see it in a graphic representation. As they say, a picture is worth a thousand words. Also, they are used to help create a visual display of data to aid in organizing and understanding what is happening on your project.
Influence Diagrams
An influence diagram is a diagrammatic representation of a project situation, showing the main entities, decision points, uncertainties, and outcomes, and indicating the relationships (influences) between them. The influence diagram can identify risks when combined with sensitivity analysis or Monte Carlo simulation to reveal sources of risk within the project.
Influence diagrams use various shapes to indicate nodes. The nodes are connected by arrows to show uncertainty, decisions, and objectives. Common shapes for nodes and their meanings are: An oval node indicates an area of uncertainty, rectangular node shows a decision, an octagonal node (or sometimes a diamond) indicates the objective or desired outcome.
Mind Mapping
A mind map is an easy way to brainstorm thoughts organically without worrying about order and structure. It allows you to visually structure your ideas to help with analysis and recall. A mind map is a technique that starts with an idea (or project) in the center. Then you branch out from the project and identify the main themes or deliverables associated with the idea. Each theme or deliverable has further details. The “branching out” continues until you have a completed mind map that provides an overview of the entire project or elements of a project under analysis.
Mind mapping is a diagrammatic method used to visually organizing information. A mind map in quality is often created around a single quality concept, drawn as an image in the center of a blank landscape page, to which associated representations of ideas such as images, words, and parts of words are added.
The mind-mapping technique may help in the rapid gathering of project quality requirements, constraints, dependencies, and relationships. If you want to be creative, you can draw, use icons, work with different color markers, and paste pictures on your mind map. Mind mapping can be a very creative and fun way to fill out the project deliverables or requirements.
Control Charts
A control chart is a graphic display of a process over time. Data points are plotted and compared to a central line (the average) and upper and lower control limits. Control charts are more common in a production or factory environment, where they can be used to measure process results. However, they can be used to measure project results, such as defects, cost and schedule variance, or any other predictable event on a project.
For example, it is predictable that you will have cost and schedule variances on your project. However, you want to make sure they are within an allowable limit. You can track the variances using a control chart to spot trends and to monitor the cost and schedule performance. Control charts measure the performance of a process to ensure it is in control.
When a process is in control the results of the process are consistent with expectations. When it is not in control there are outliers or unexpected results. Control charts can be used in quality planning, when establishing processes and tolerance levels that determine whether the process is in control
Estimation Methods
Estimating is a way of life on projects. We are continually estimating durations, resource needs, and costs. In this blog section we are covering Estimation methods that are most common used in project management, such as analogous, parametric, and three-point estimating.
Three-point Estimating
The accuracy of single-point duration estimates may be improved by considering estimation uncertainty and risk. Using three-point estimates helps define an approximate range for an activity’s duration. This is a great project management technique to use when you need to account for uncertainty in your estimates. When a lot of uncertainty, risk, or unknowns surround an activity or a work package, three-point estimating will give you a range of outcomes and an expected duration or cost estimate.
It is called three-point estimating because you start with three estimates. The first estimate represents the best-case scenario, also known as an optimistic estimate. The next is what you consider the most likely scenario, and the last is the worst-case or pessimistic estimate. Notice we use the word “scenario.” This is because you are developing estimates based on an assumed situation.
The simplest way to develop a three-point estimate is to sum the three estimates and divide by three. This gives you an average. However, this isn’t the most accurate way because it assumes an equal probability that the optimistic, most likely, and pessimistic scenarios would occur, and that’s not realistic.
Analogous Estimating
An estimation method that in its most basic form analogous estimating compares past projects with the current project, determines the areas of similarity and the areas of difference, and then develops an estimate based on that information.
A more robust application determines the drivers for the estimate and analyzes the relationship between past similar projects and the current project. Drivers can include size, complexity, weight, or other aspects of the component for which you are developing an estimate.
Analogous estimates are often used early in the project at a high level. There is an expectation that there will be a range of estimates and that the range will be progressively narrowed as more detailed information is uncovered. However, you can develop an analogous estimate at any level of detail. The benefits of using analogous estimates are that they are relatively quick to develop, and they’re not very costly to develop. However, because they’re usually done at a high level, they’re not the most accurate method.

Interpersonal Skills
They are some of the most important skills you can have when leading a project. Many of the leadership skills we need to exhibit, as project managers, are interpersonal and team skills.
Problem Solving
Problem solving is the deliberate act of identifying the problem, identifying and prioritizing alternatives to resolve the problem, and selecting and implementing the solution. The best approach to problem solving depends on the nature of the problem.
A simple problem is one that can be easily defined and the solution can be easily understood and implemented. Simple problems are best resolved by one person who is qualified to understand the implications of potential solutions.
A complex problem may be difficult to define, and the solution or decision may also be hard to clarify. There may be multiple stakeholder groups with opposing ideas about what a good solution looks like. The environment may be volatile. All these aspects add complexity to a problem or decision. For complex problems, you get better results when working with a group of people with diverse perspectives.
Another aspect to consider when solving problems is the style of thinking in solving the problem. Some problems require divergent thinking. This means brainstorming, generating multiple options, and being open to nontraditional ways of approaching the situation. In other situations, a convergent style of thinking is best. In other words, it means narrowing down options and choosing between a limited number of options
Other Tools and Techniques
They are a catch-all for project management tools and techniques that don’t fit in any other category, but that are important methods to know about hen managing a project. Some of them are foundational methods that project management is built on, such as critical path method, and rollingwave planning.
Prompt Lists
A prompt list is a predetermined list of risk categories that might give rise to individual project risks and that could also act as sources of overall project risk. The prompt list can be used as a framework to aid the project team in idea generation when using risk identification techniques. Prompt lists identify high-level categories of risks. They are used to help ensure that all areas are considered when identifying project event risks and overall project risks. A prompt list is not exhaustive; rather it is used to help focus attention on different categories of risk so that risk identification is robust and thorough.
Different industries and professions should have different prompt lists. For example, an aerospace firm would not have the same types of risks as an environmental cleanup organization. The following generic list can be further decomposed into subcategories that are appropriate for your project to make it more robust.
Some of these categories are more applicable to overall risk, such as volatility, ambiguity, and uncertainty. Other categories are more applicable to event risks, such as team resources, stakeholders, schedule, and budget.
Resource Optimization
Resource optimization methods are used to adjust the start and finish dates of activities to adjust planned resource use to be equal to or less than resource availability. Resource optimization is done after the initial critical path is identified. At that point, you load your resources into the scheduling tool. Often, you will find that one or more resources are over- allocated.
For example, you may have scheduled a resource to work full time on more than one activity at the same time. Another example is if you have a resource for a limited amount of time (ten hours per week), but you have scheduled the resource for more time than that. Resource optimization adjusts the start and finish dates to make the best use of your resources.
There are two ways to optimize your resources; you can level them, or you can smooth them. Resource leveling adjusts activity start and finish dates so that resources are no longer over-allocated. Leveling frequently pushes out the due date. Resource smoothing is similar to resource leveling, but it adjusts activities within their float amounts, therefore it does not change the critical path. Smoothing resources is achieved by delaying some work or activities.

As a conclusion, project management brings together a set of tools and techniques—performed by people—to describe, organize, and monitor the work of project activities. Project managers are the people responsible for managing the project processes and applying the project management tools and techniques used to carry out the project activities. All projects are composed of processes, even if they employ a haphazard approach. There are many advantages to organizing projects and teams around the project management processes.
As a professional project manager, and in order to manage projects successfully, you should have an advanced knowledge of different project management tools and techniques that can be applied throughout the project lifecycle on various project activities to produce desired outcomes.
f you have advanced knowledge and experience in project management, or if you are a project manager or part of the project management team, including for large projects in complex environments, then the PMP® certification is an excellent choice for you. To know more about this certification, check out the link here.
.jpg)
.jpg)