While planning the schedule in your project, you need to sequence the project activities. Sequence activities is the process of identifying and documenting relationships among the project activities in order to define the logical sequence of work to obtain the greatest efficiency given all project constraints.
Every activity except the first and last should be connected to at least one predecessor and at least one successor activity with an appropriate logical relationship. Logical relationships should be designed to create a realistic project schedule. Sequencing can be performed by using project management software or by using manual or automated techniques. This process concentrates on converting the project activities from a list to a project network diagram to act as a first step to publish the schedule baseline.
What is Project Schedule Management?
Project scheduling provides a detailed plan that represents how and when the project will deliver the products, services, and results defined in the project scope and serves as a tool for communication, managing stakeholders’ expectations, and as a basis for performance reporting.
The project management team selects a scheduling method, such as a critical path or an agile approach. Then, the project-specific data, such as the activities, planned dates, durations, resources, dependencies, and constraints, are entered into a scheduling tool to create a schedule model for the project. The result is a project schedule.
For smaller projects, defining activities, sequencing activities, estimating activity durations, and developing the schedule model are so tightly linked that they are viewed as a single process that can be performed by a person over a relatively short period of time.
When possible, the detailed project schedule should remain flexible throughout the project to adjust for knowledge gained, increased understanding of the risk, and value-added activities.
Network Diagrams in Project Management
After identifying the project activities, you need to sequence them in a logical order and find out whether dependencies exist among the activities. The interactivity of logical relationships must be sequenced correctly in order to facilitate the development of a realistic, achievable project schedule. The key outcome of this activity will be producing a project network diagram.
While sequencing project activities, you will heavily rely on the precedence diagramming method technique. The precedence diagramming method (PDM) is a technique used for constructing a schedule model in which activities are represented by nodes and are graphically linked by one or more logical relationships to show the sequence in which the activities are to be performed.
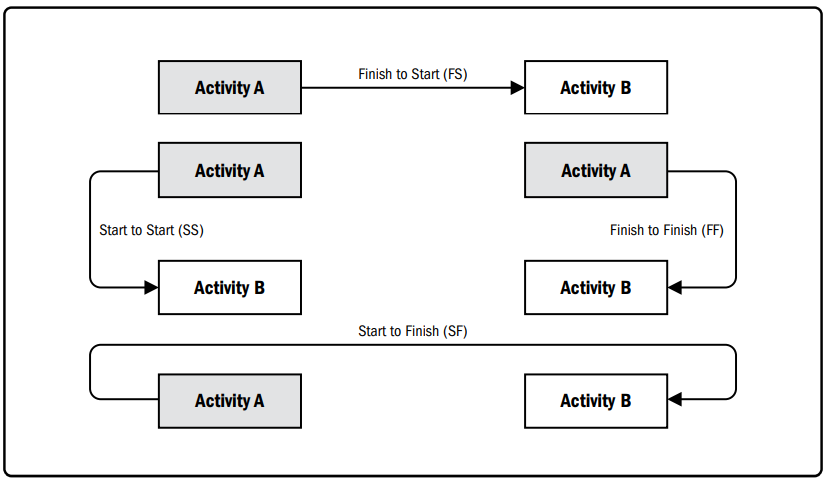
Precedence diagramming method includes four types of dependencies or logical relationships. A predecessor activity is an activity that logically comes before a dependent activity in a schedule. A successor activity is a dependent activity that logically comes after another activity in a schedule.
- Finish-to-start (FS). A logical relationship in which a successor activity cannot start until a predecessor activity has finished. For example, installing the operating system on a PC (successor) cannot start until the PC hardware is assembled (predecessor).
- Finish-to-finish (FF). A logical relationship in which a successor activity cannot finish until a predecessor activity has finished. For example, writing a document (predecessor) is required to finish before editing the document (successor) can finish.
- Start-to-start (SS). A logical relationship in which a successor activity cannot start until a predecessor activity has started. For example, level concrete (successor) cannot begin until pour foundation (predecessor) begins.
- Start-to-finish (SF). A logical relationship in which a successor activity cannot finish until a predecessor activity has started. For example, a new accounts payable system (successor) has to start before the old accounts payable system can be shut down (predecessor).

Two activities can have two logical relationships at the same time (for example, SS and FF). Multiple relationships between the same activities are not recommended, so a decision has to be made to select the relationship with the highest impact. Closed loops are also not recommended in logical relationships.
The most common kind of dependency is the Finish to Start. It means that one task needs to be completed before another one can start. There are a few other kinds of dependencies, though. They can all be used in project network diagrams to show the order of activities.
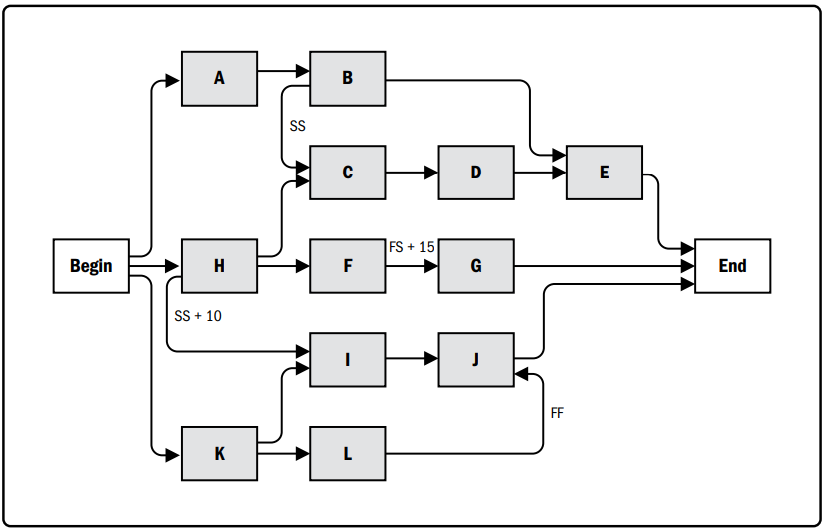
As you sequence the activities, you will find new activities that need to be added and new attributes for activities that you didn’t know about. So, the main product of this process is the project network diagram. Below is an example of a network diagram.

Project network diagrams are commonly presented in the activity-on-node diagram format showing activities and relationships without a time scale, sometimes referred to as a pure logic diagram, or presented in a time-scaled schedule network diagram format that is sometimes called a logic bar chart.
Project network diagrams, with activity date information, usually show both the project network logic and the project’s critical path schedule activities. This example also shows how each work package is planned as a series of related activities.
Another presentation of the project schedule network diagram is a time-scaled logic diagram. These diagrams include a time scale and bars that represent the duration of activities with the logical relationships. They are optimized to show the relationships between activities where any number of activities may appear on the same line of the diagram in sequence.
Dependencies, Leads, and Lags
Network diagram dependencies may be characterized by the following attributes: mandatory or discretionary, internal or external. Dependency has four attributes, but two can be applicable at the same time in the following ways: mandatory external dependencies, mandatory internal dependencies, discretionary external dependencies, or discretionary internal dependencies.
- Mandatory dependencies. Mandatory dependencies are those that are legally or contractually required or inherent in the nature of the work. Mandatory dependencies often involve physical limitations, such as on a construction project, where it is impossible to erect the superstructure until after the foundation has been built, or on an electronics project, where a prototype has to be built before it can be tested.
- Discretionary dependencies. Discretionary dependencies are sometimes referred to as preferred logic, preferential logic, or soft logic. Discretionary dependencies are established based on knowledge of best practices within a particular application area or some unusual aspect of the project where a specific sequence is desired, even though there may be other acceptable sequences.
- External dependencies. External dependencies involve a relationship between project activities and non-project activities. These dependencies are usually outside of the project team’s control.
- Internal dependencies. Internal dependencies involve a precedence relationship between project activities and are generally inside the project team’s control.
A lead is the amount of time a successor activity can be advanced with respect to a predecessor activity. For example, on a project to construct a new office building, the landscaping could be scheduled to start 2 weeks prior to the scheduled punch list completion.
A lag is the amount of time a successor activity will be delayed with respect to a predecessor activity. For example, a technical writing team may begin editing the draft of a large document 15 days after they begin writing it. This can be shown as a start-to-start relationship with a 15-day lag.
Critical Path Method
The critical path method is used to estimate the minimum project duration and determine the amount of schedule flexibility on the logical network paths within the schedule model. This schedule network analysis technique calculates the early start, early finish, late start, and late finish dates for all activities without regard for any resource limitations by performing a forward and backward pass analysis through the project network diagram.
The critical path is the sequence of activities that represents the longest path through a project, which determines the shortest possible project duration. The longest path has the least total float—usually zero. The resulting early and late start and finish dates are not necessarily the project schedule; rather they indicate the time periods within which the activity could be executed, using the parameters entered in the schedule model for activity durations, logical relationships, leads, lags, and other known constraints.
The critical path method is used to calculate the critical path(s) and the amount of total and free float or schedule flexibility on the project network diagram within the schedule model. On any network path, the total float or schedule flexibility is measured by the amount of time that a scheduled activity can be delayed or extended from its early start date without delaying the project finish date or violating a schedule constraint. A critical path is normally characterized by zero total float on the critical path.
Critical paths may have positive, zero, or negative total float depending on the constraints applied. Positive total float is caused when the backward pass is calculated from a schedule constraint that is later than the early finish date that has been calculated during forward pass calculation.
Negative total float is caused when a constraint on the late dates is violated by duration and logic. Negative float analysis is a technique that helps to find possible accelerated ways of bringing a delayed schedule back on track. Project network diagrams may have multiple near-critical paths. Many software packages allow the user to define the parameters used to determine the critical path(s).
Adjustments to activity durations (when more resources or less scope can be arranged), logical relationships (when the relationships were discretionary to begin with), leads and lags, or other schedule constraints may be necessary to produce network paths with a zero or positive total float.
Once the total float and the free float have been calculated, the free float is the amount of time that a scheduled activity can be delayed without delaying the early start date of any successor or violating a schedule constraint.
As a conclusion, a project network diagram is a graphical representation of the logical relationships, also referred to as dependencies, among the project schedule activities. A project network diagram is produced manually or by using project management software. It can include full project details, or have one or more summary activities.
Activities that have multiple predecessor activities indicate a path convergence. Activities that have multiple successor activities indicate a path divergence. Activities with divergence and convergence are at greater risk as they are affected by multiple activities or can affect multiple activities.
If what we explained in this article is part of your day-to-day job, or if you are interested in improving your knowledge in the project management field, you can have a look at the curriculum of our PMP exam preparation workshop.


.jpg)


.jpg)
.jpg)